Customer Segmentation & Churn Prediction System
Production-grade customer churn prediction and segmentation platform built with XGBoost, SHAP, MLflow, FastAPI, and Docker.
This project is a production-grade customer churn prediction and segmentation platform built with XGBoost, SHAP, MLflow, FastAPI, and Docker. The project is designed to support reproducible training, explainable predictions, and low-latency inference for real-world retention workflows.
Customer Segmentation
This system predicts which customers are most likely to churn, explains the model's decision drivers, and segments customers into business-ready risk groups. It combines a leak-free preprocessing pipeline, Optuna-tuned XGBoost model training, SHAP-based explanations, and an API-first deployment path.
The platform is suitable for:
- customer success and retention teams
- product analytics and growth teams
- portfolio-ready ML engineering demonstrations
- production inference behind FastAPI or containers
Business Problem
Subscription and telecom businesses lose revenue when high-value customers silently disengage. A strong churn model helps teams:
- identify at-risk accounts before cancellation
- prioritize retention outreach by expected customer value
- explain why the model believes a customer is at risk
- measure the impact of retention campaigns over time
The business goal is not just prediction accuracy. It is actionable churn intelligence that supports intervention decisions.
System Design
The system has three interconnected components:
        ↓
Data Cleaning & Preprocessing
        ↓
 ┌──────────────────────────────┐
 │   Feature Engineering Layer  │
 │  • Encoding                  │
 │  • Scaling                   │
 │  • Imbalance Handling        │
 │  • Train/Test Split          │
 └──────────────┬───────────────┘
                ↓
 ┌──────────────────────────────┐
 │    XGBoost Churn Model       │  ← Who is likely to churn?
 │  • Optuna Hyperparameter     │
 │    Optimization              │
 │  • ROC-AUC Optimization      │
 │  • Threshold Tuning          │
 └──────────────┬───────────────┘
                ↓
 ┌──────────────────────────────┐
 │      Model Evaluation        │
 │  • Confusion Matrix          │
 │  • ROC Curve                 │
 │  • Precision-Recall Curve    │
 │  • Feature Importance        │
 └──────────────┬───────────────┘
                ↓
 ┌──────────────────────────────┐
 │     SHAP Explainability      │  ← Why are customers at risk?
 │  • Global Feature Impact     │
 │  • Local Prediction Analysis │
 │  • Churn Driver Discovery    │
 └──────────────┬───────────────┘
                ↓
 ┌──────────────────────────────┐
 │   Production Deployment      │
 │  • FastAPI Architecture      │
 │  • MLflow Tracking (Planned) │
 │  • Docker Deployment         │
 └──────────────────────────────┘
Pipeline Flow
- Data is loaded from the Telco churn dataset.
- Features are cleaned and validated.
- Train, validation, and test splits are created with stratification.
- A ColumnTransformer fits only on training data to prevent leakage.
- Optuna tunes XGBoost hyperparameters.
- Evaluation metrics and artifacts are logged to MLflow.
- SHAP generates global and local explanations.
- FastAPI serves predictions and risk drivers from cached artifacts.
ML Pipeline
1. Preprocessing
- Handles missing values with median/mode imputation.
- Splits features into numeric and categorical groups.
- Scales numeric fields with StandardScaler.
- Encodes categorical fields with OneHotEncoder.
- Fits preprocessing only on training data.
2. Modeling
- Uses XGBoost as the main classifier.
- Handles class imbalance through
scale_pos_weight. - Tunes hyperparameters with Optuna.
- Uses stratified train/validation/test splits.
3. Evaluation
- Primary metric: ROC-AUC.
- Secondary metrics: Precision, Recall, F1, PR-AUC, Accuracy.
- Threshold optimization is applied instead of hard-coding 0.5.
- Confusion matrix, ROC curve, and PR curve artifacts are generated.
Evaluation Results
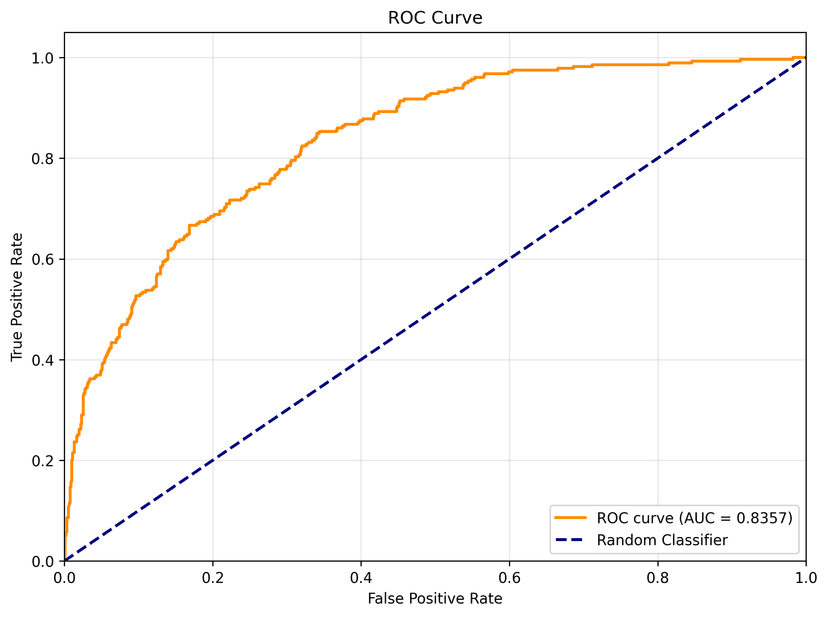
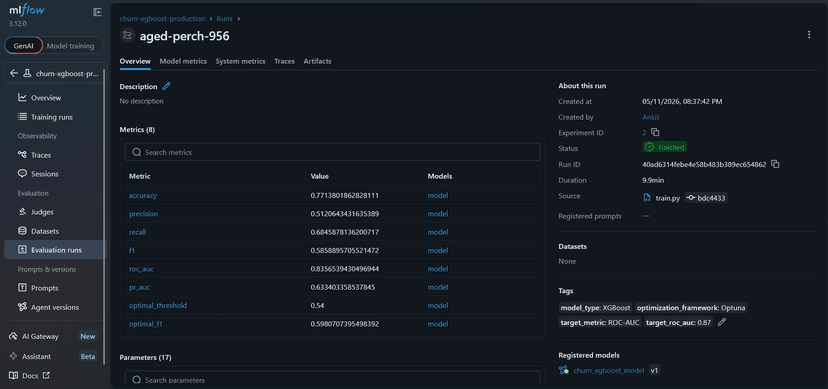
The XGBoost model achieved an accuracy of 77.14% with a precision of 51.21%, recall of 68.46%, and an F1-score of 58.59% on the test dataset. The model obtained a strong ROC-AUC score of 0.8357 and a PR-AUC score of 0.6334, indicating good discrimination capability on imbalanced churn data.
Using an optimal classification threshold of 0.54, the model achieved its best F1-score of 0.5981.
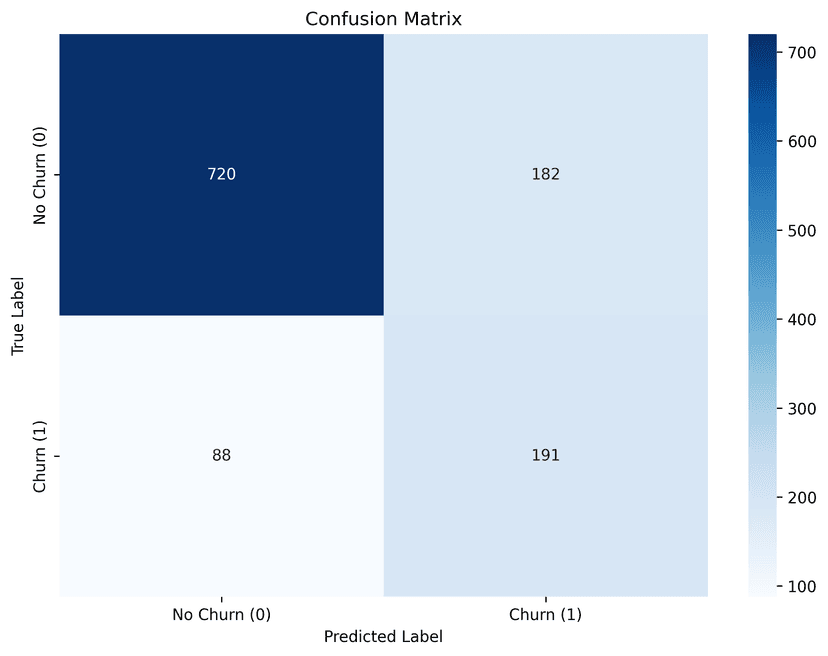
From the confusion matrix:
- 720 customers were correctly classified as non-churners.
- 191 customers were correctly identified as churners.
- 182 non-churn customers were incorrectly predicted as churners.
- 88 churn customers were missed by the model.
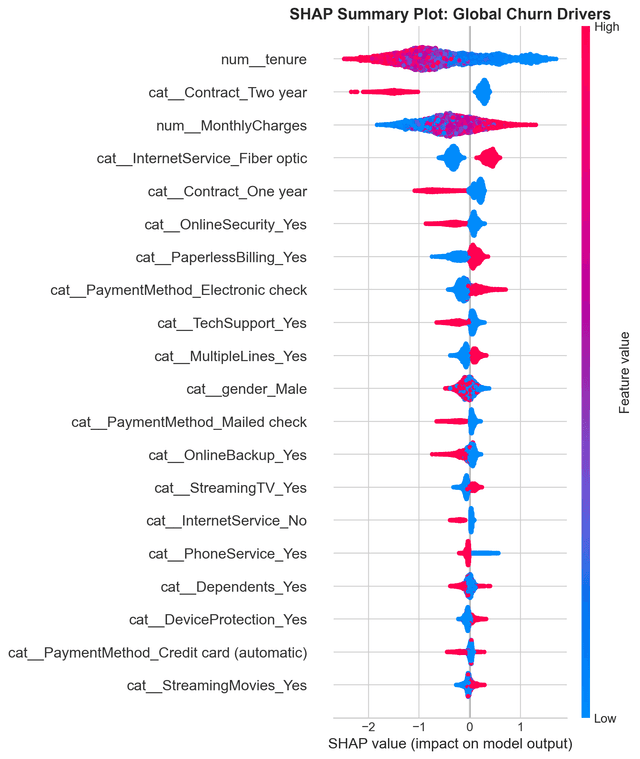
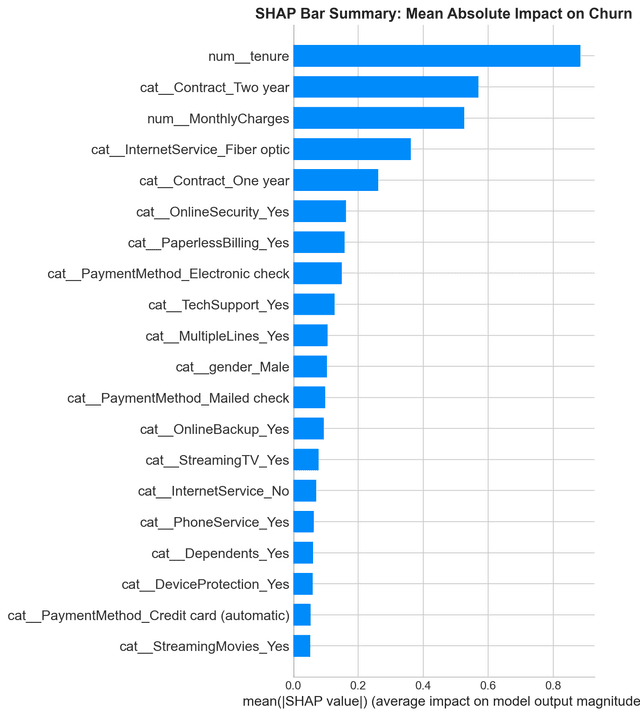
SHAP analysis showed that the most important features influencing churn prediction were:
- Customer tenure
- Contract type
- Monthly charges
- Internet service type
- Online security and tech support services
{
  "model_type": "XGBoost",
  "target_column": "Churn",
  "hyperparameters": {
    "max_depth": 11,
    "learning_rate": 0.030834348179355788,
    "n_estimators": 369,
    "subsample": 0.5102922471479012,
    "colsample_bytree": 0.9849549260809971,
    "min_child_weight": 9,
    "gamma": 1.0616955533913808,
    "scale_pos_weight": 3.237934904601571,
    "random_state": 42,
    "n_jobs": -1,
    "verbosity": 0
  },
  "metrics": {
    "test": {
      "accuracy": 0.7713801862828111,
      "precision": 0.5120643431635389,
      "recall": 0.6845878136200717,
      "f1": 0.5858895705521472,
      "roc_auc": 0.8356539430496944,
      "pr_auc": 0.633403358537845,
      "optimal_threshold": 0.54,
      "optimal_f1": 0.5980707395498392
    }
  },
  "model_path": "models\\churn_model.pkl",
  "preprocessor_path": "models\\preprocessor.pkl",
  "label_encoder_path": "models\\label_encoder.pkl"
}
Explainability — SHAP
A churn score alone isn't enough. A business stakeholder asking "why is this customer at risk?" needs a real answer — not just a number.
SHAP (SHapley Additive exPlanations) provides per-prediction feature importance, answering exactly that question.
For each at-risk customer, the system surfaces:
- The top factors driving their churn risk (e.g., "no logins in 14 days", "3 unresolved support tickets")
- The magnitude of each factor's contribution
- Global feature importance across the full customer base
This transforms the system from a black box into an actionable diagnostic tool — account managers know exactly what to address in a retention call.
Key Insights
- Strong churn detection performance with ROC-AUC = 0.8357
- Model optimized toward higher recall for churn identification
- Captures 68.46% of churn customers
- Top churn drivers:
- Tenure
- Contract type
- Monthly charges
- Fiber optic service
Output Images